
Menu of cybersecurity risk management options
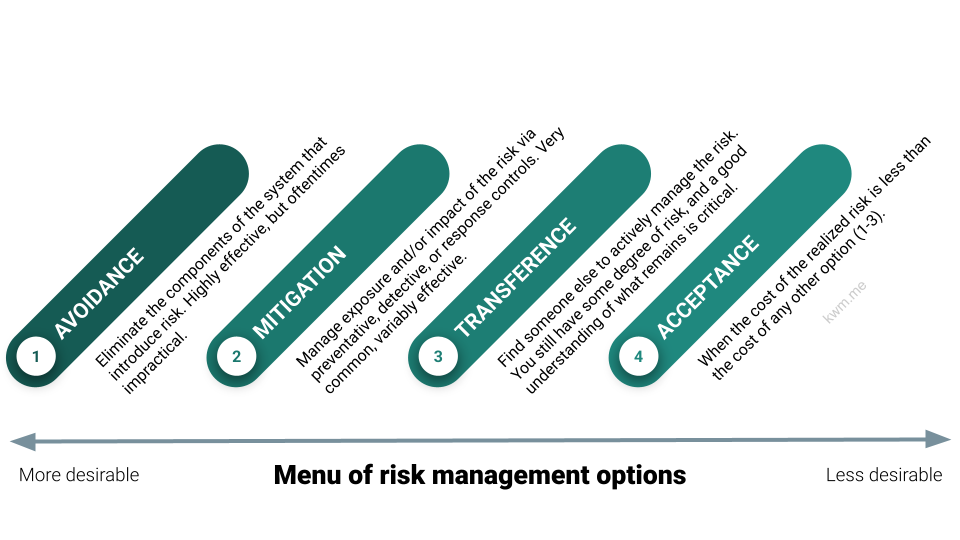
A simple visualization of risk management options, explained in the context of cybersecurity but broadly applicable.
Avoidance
Eliminate at-risk components entirely—ideal when practical, though it rarely is.
A common example is credit card processing. Many organizations choose not to store or process credit card data, instead using third-party gateways. This avoids the risks, costs, and compliance burdens (e.g., PCI DSS) of handling sensitive card information internally.
Mitigation
Manage risk exposure or impact using preventive, detective, or response controls—the most common cybersecurity approach.
Most cybersecurity products and services focus on mitigation. Endpoint detection and response (EDR), identity security solutions (IdPs), cloud security, security event management platforms (data lakes, SIEM), and managed security services (MSSP, MDR) all help mitigate present and emerging risks.
Transference
Find someone else to actively manage the risk. You still have a risk, and transference is rarely wholesale, so a good understanding of your remaining risk is critical.
“Risk transference” used to be largely synonymous with “insurance.” Today, using cloud-based applications or infrastructure is one of the most common forms of cybersecurity risk transference. Availability, integrity, product security and more are shared with the vendor, allowing the customer to build upon a strong foundation. That said, widespread adoption of these technologies has also created a tremendous concentration of trust, which can have a disastrous impact if and when adversaries compromise cloud vendors.
Acceptance
Evaluate the potential cost of a realized risk. If prevention or mitigation costs aren’t justified, explicitly accept the risk and plan accordingly. Often the least desirable option for security practitioners—though business leaders may be more willing.
A typical scenario involves legacy or niche applications running despite known vulnerabilities, risk of failure, or other scenarios. When mitigating or replacing such systems is too costly, risks are accepted, often supplemented by basic mitigations like isolation or enhanced disaster recovery planning.