I don’t know much about threat modeling, except that as long as I’ve been working in cybersecurity, we’ve been asking people about their threat model, telling them to do threat modeling, and in the worst cases using greedy threat models to convince folks that they should prioritize things that they probably should not.
I believe that, like most things in this industry, there’s a very approachable and “plenty good enough” version of threat modeling that would benefit a good enough percentage of organizations. In an effort to figure that out, I came across this handful of resources covering core threat modeling concepts and frameworks, real-world threat models, and tools you might find useful.
Learning about threat modeling
Adam Shostack
The canonical reference is Threat Modeling: Designing for Security by Adam Shostack. If you’re interested in threat modeling, you should read it. I’ve tried to read or page through a couple of other books, and frankly none of them compare.
Shostack also provides a beginner’s guide, which is less instructive and more of an overview of the purpose of threat modeling and a roundup of models and methodologies. This guide perfectly frames why we threat model by way of the specific questions that we should be trying to answer, using his Four Question Framework:
- What are we working on?
- What can go wrong?
- What are we going to do about it?
- Did we do a good job?
If you’re in search of “plenty good enough” threat modeling, answering these four questions relative to your subject system or application is a really great place to start.
Kevin Riggle, for Increment (Stripe)
The title and introduction to An introduction to approachable threat modeling say a lot:
Threat modeling is one of the most important parts of the everyday practice of security, at companies large and small. It’s also one of the most commonly misunderstood. Whole books have been written about threat modeling, and there are many different methodologies for doing it, but I’ve seen few of them used in practice. They are usually slow, time-consuming, and require a lot of expertise.
Riggle proposes a four-question framework based on Principals, Goals, Adversities, and Invariants:
- What is the system, and who cares about it?
- What does it need to do?
- What bad things can happen to it through bad luck, or be done to it by bad people?
- What must be true about the system so that it will still accomplish what it needs to accomplish, safely, even if those bad things happen to it?
The examples are few, clear, and illustrative.
Additional learning resources
Threat modeling examples
I learn best by example, and I’ve found that threat modeling examples–the outputs of the process–can be hard to come by.
Related: I threw together a free threat modeling template based on some of these examples.
AWS KMS, by Costas Kourmpoglou / Airwalk Reply
This excellent AWS KMS Threat Model leverages security model and product documentation from AWS and identifies a tabular list of threats.
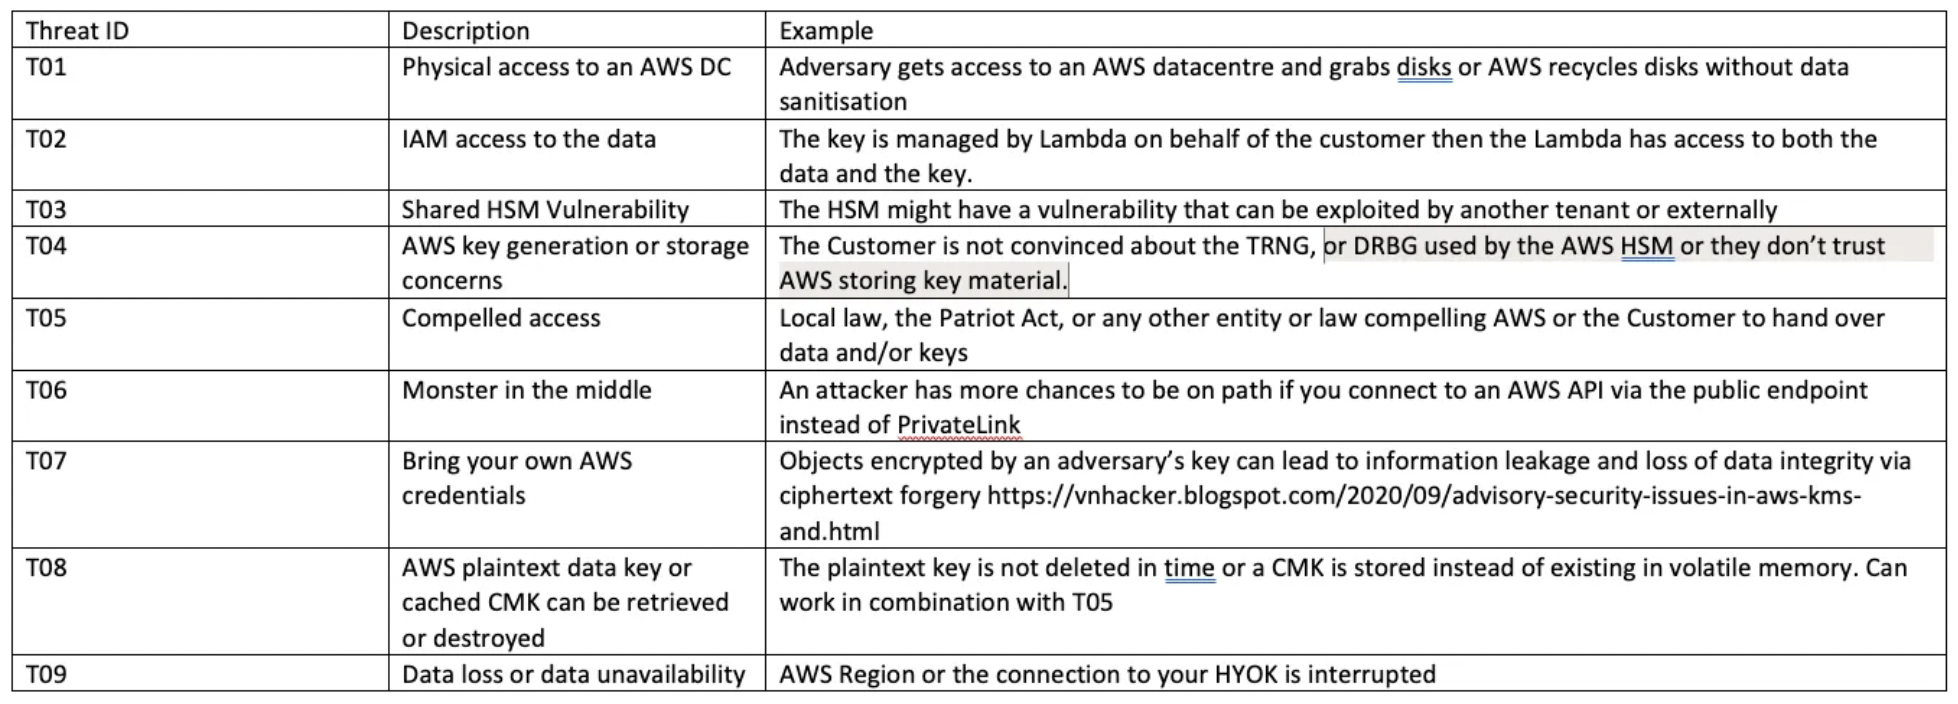
For decision-making purposes, this flowchart makes it easy to determine which key management option you should choose based on standard trust boundaries:
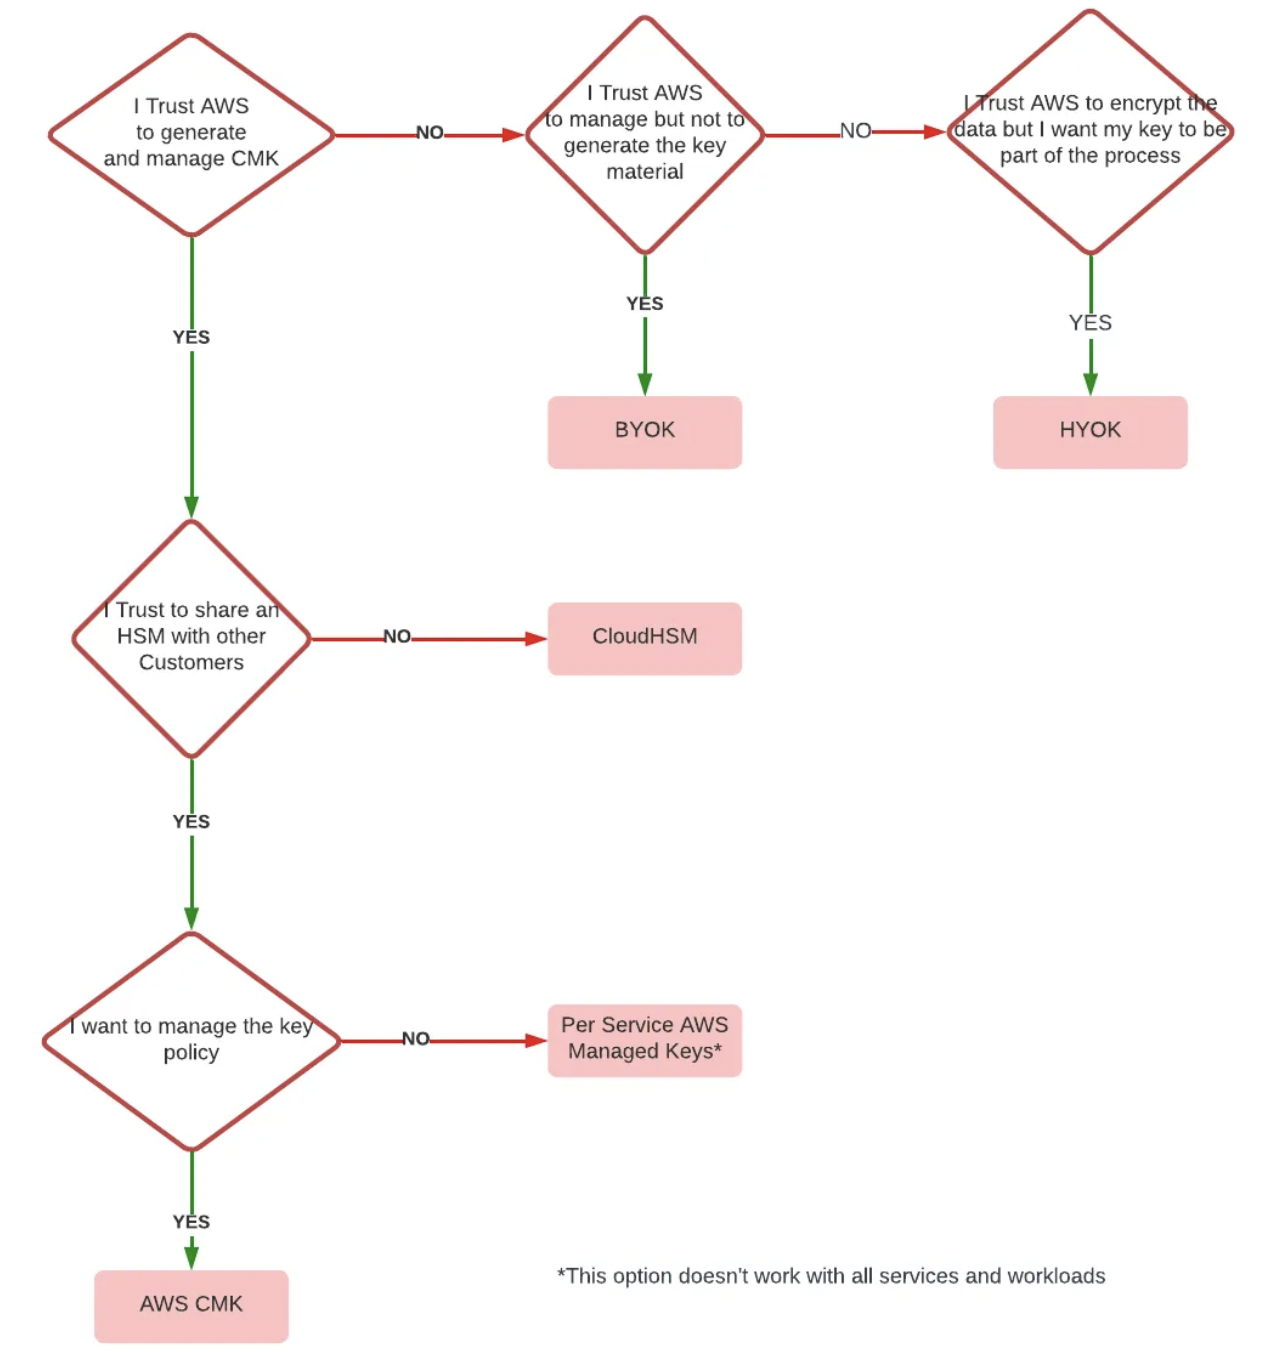
Google Cloud Storage, by NCC Group
One of the best cloud infrastructure (IaaS or PaaS) threat models I’ve seen is by Ken Wolstencroft and the folks at NCC Group: Threat Modelling Cloud Platform Services by Example: Google Cloud Storage. This is a good reference for anyone looking to implement a STRIDE-based threat model.
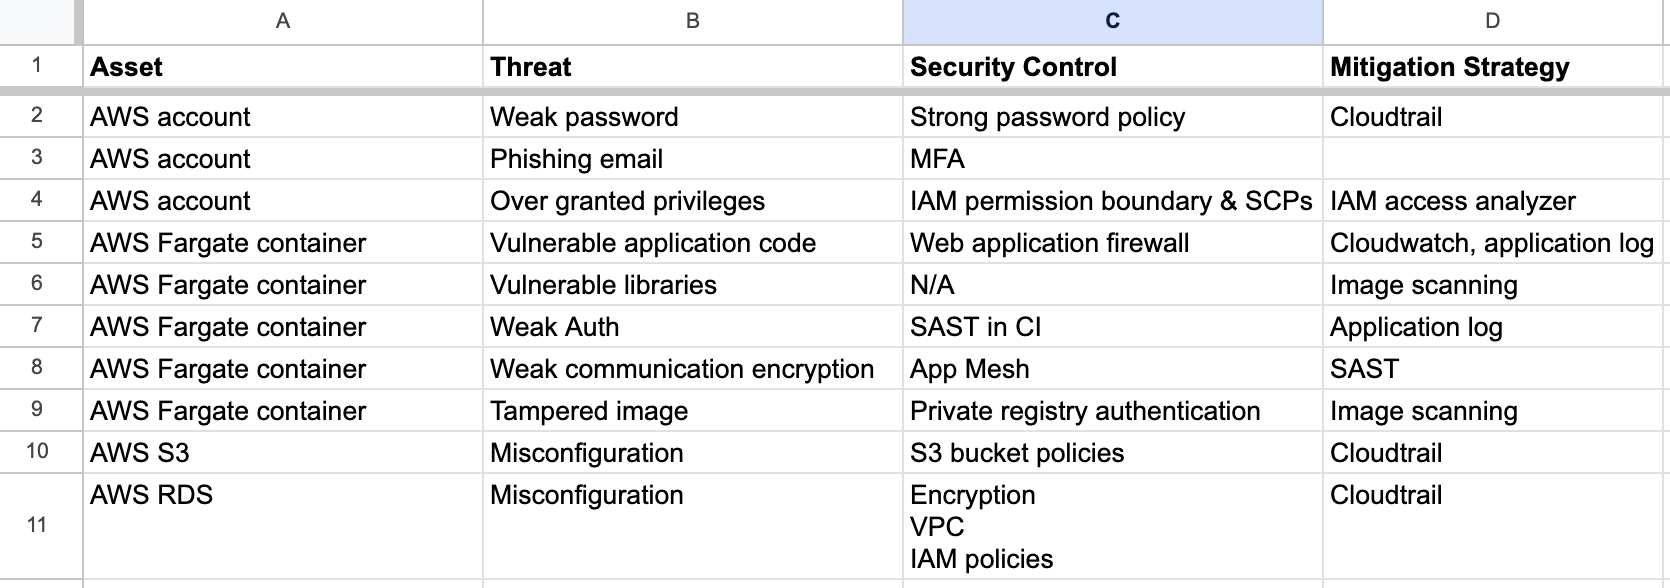
AWS ECS Fargate threat model by Sysdig
This ECS Fargate threat model by Sysdig provides output in the form of a table:
- Assets
- Threats
- Security controls
- Mitigations
Cloud environments are often a rat’s nest of services, so I like the idea of being able to “stack” threat models, and do things like identify a unique set of security controls or mitigations.
TLS v1.2 threat model
This may be one of the most concise representations of a threat model available, and is an excellent example of an ideal final output of a threat modeling exercise: A prose explanation of the purpose of the application, assumptions about operator and attackers, and how the application design addresses threats (which may include acknowledging a threat but not attempting to mitigate it at all).
The TLS protocol is designed to establish a secure connection between a client and a server communicating over an insecure channel. This document makes several traditional assumptions, including that attackers have substantial computational resources and cannot obtain secret information from sources outside the protocol. Attackers are assumed to have the ability to capture, modify, delete, replay, and otherwise tamper with messages sent over the communication channel.
See RFC 5246 - The Transport Layer Security (TLS) Protocol Version 1.2, Appendix F (Security Analysis) for the remainder of the analysis.
Kane Narraway does a great job easing into a threat model for enterprise AI search by starting with key tradeoffs and decisions, and then presenting an organized threat model and corresponding diagram.
Other threat modeling examples
Notably, there are some threat models that have been codified as their own RFCs:
And these are collections of a wide variety of threat models and threat model formats:
And of course, everyone loves to software their way out of or through a process problem, so here’s some software that came recommended.
End-to-end tools for threat modeling.
Useful for diagraming, visualizing, and collaborating on threat models.
Templates
Useful for capturing the output of threat modeling exercises.
Alternatives to threat modeling
One thing that’s apparent from all of the above is that there’s no established means of threat modeling, and certainly no “right” way. Considering threats and making purposeful decisions regarding whether or how you’ll mitigate them is better than doing nothing, and more important than any set of processes or artifacts. That said, using an established process and repeating it will mean that you mature your understanding of both the systems and the threats, so it’s worth doing consistently and well.
Mozilla Rapid Risk Assessment (RRA)
Of course, sometimes what you need is a fast, good enough risk assessment. The Mozilla Rapid Risk Assessment (RRA) process is intended to be very fast (~30 minutes).
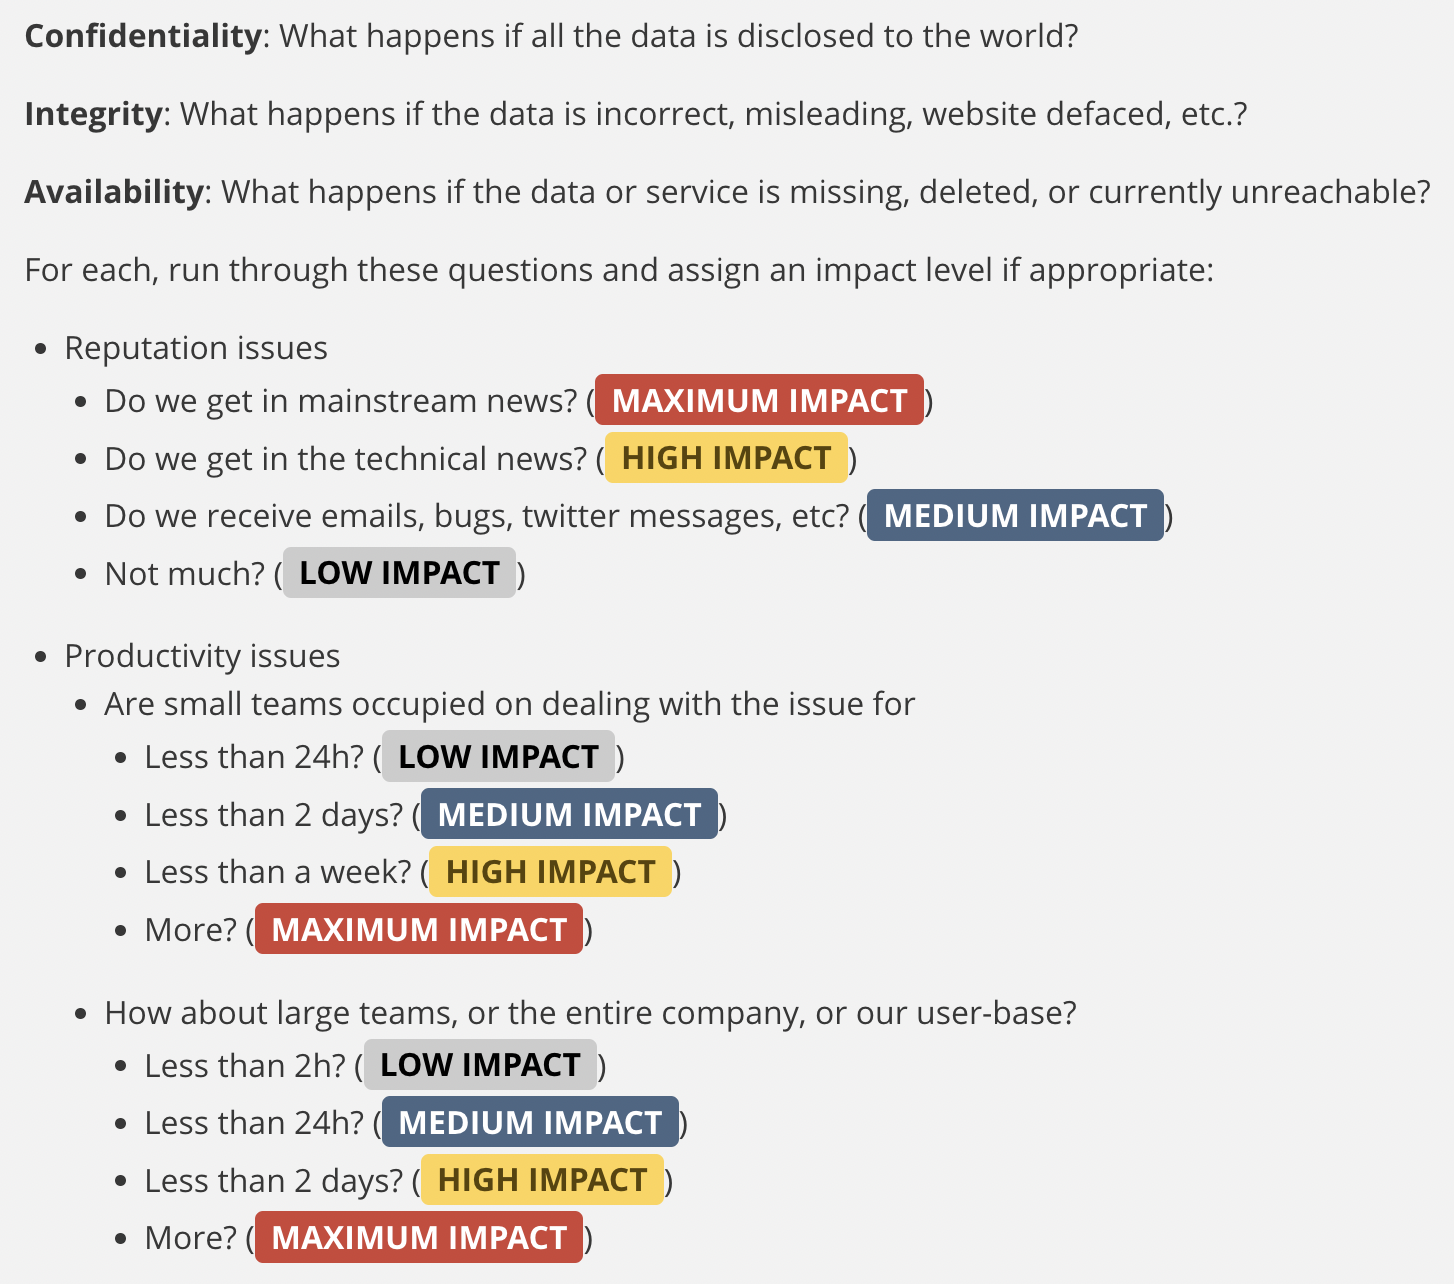
One thing that I appreciate is the simplicity of their list of issues and corresponding impacts. When defining any type of risk or incident management policy, it’s common to get hung up on questions like “what’s the difference between medium and high impact?” This list is a convenient shortcut and will speed up risk classification and determination of impact.
